January 28 2026
In a recent reading assigned for class, the book Research Theatre, Climate Change, and the Ecocide Project was quoted for the following:
"The first thing that makes climate change difficult to represent in art is the maddening fact that climate – unlike weather – can never be directly experienced. As the aggregation of numerous atmospheric and weather phenomena, climate does not manifest itself in any single moment, even, or location. The only way it can be apprehended is through data and modeling – through systems and mediations – all of which have to be processed cognitively and intellectually."
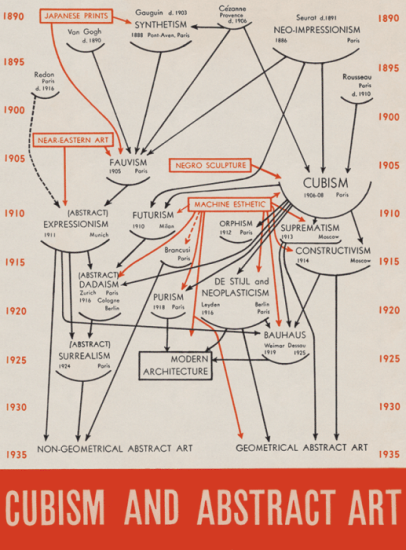
I thought this was interesting because abstract art is often described as being mediated by the intellectual. Abstract art is attractive for its ideas, the ideas that Kazimir Malevich explained to be pure creation as opposed to art's typical imitation of nature ("From Cubism and Futurism to Suprematism"). I learned in the introduction to the English translation of Deleuze’s Francis Bacon: The Logic of Sensation of a similar distinction made by Erwin Straus between perception and sensation; perception as how we rationally conceptualize a geographical map, and sensation as the body’s navigation through the perspectival space of a landscape. Deleuze argues in this same book that both figurative and abstract painting "pass through the brain, they do not act directly upon the nervous system."
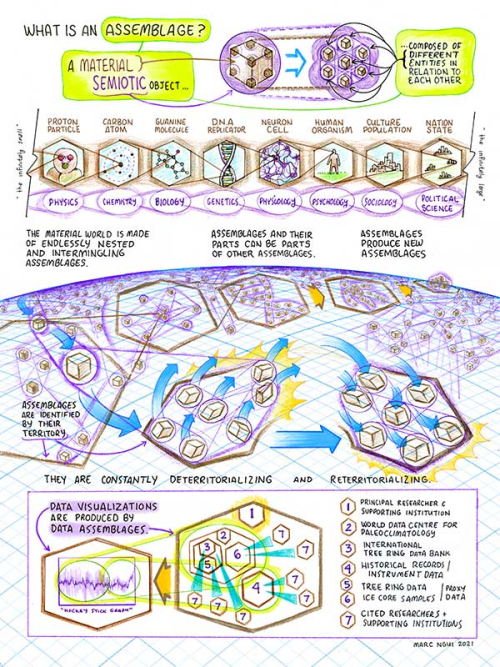
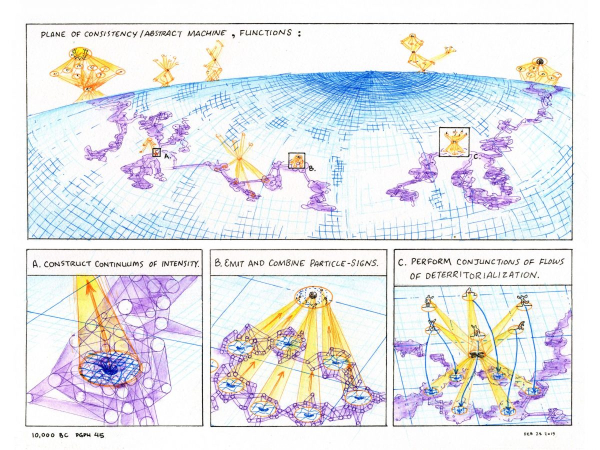
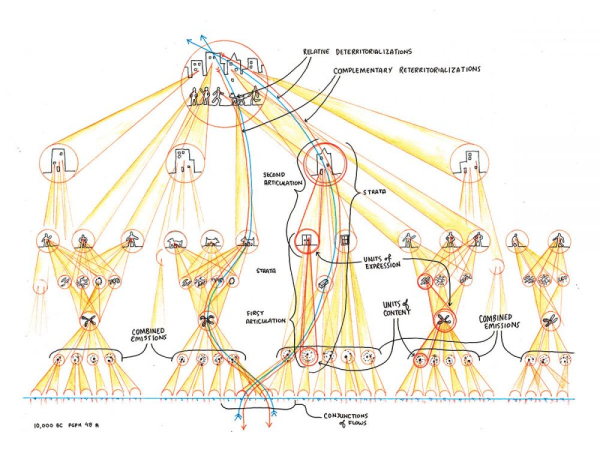
This is all to stay that I love graphs. I don’t understand them, just as much I struggle to follow maps, which might mean to Erwin Straus that I’m lacking perceptually. But I like to look at visualisations of information. A sort of diagram that I especially like to look at is the series of drawings by happy sleepy that visualizes the “Geology of Morals” from A Thousand Plateaus (a series of drawings I’ve mentioned twice already, here and here). I understood nothing in the “Geology of Morals” but I think that these are nice.
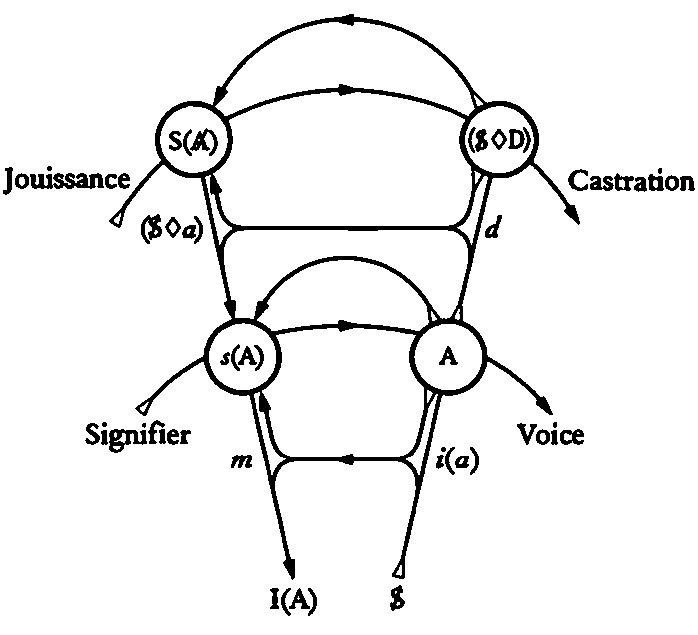
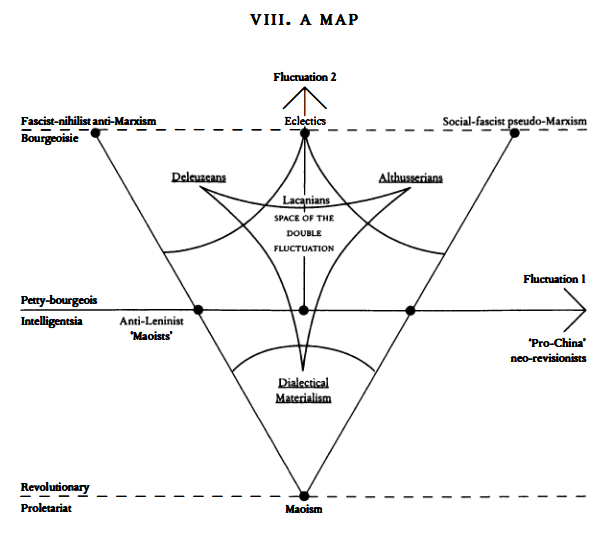
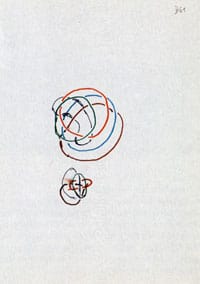
French philosophy has produced many great graphs. My favourite is Lacan’s graph of desire, and I thought this one on the right by Badiou was funny.
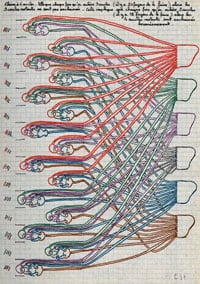
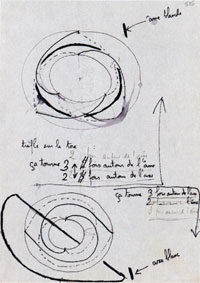
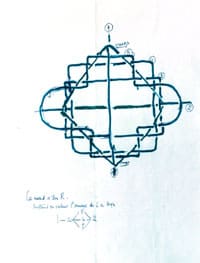
Lacan’s exchanges with mathematicians on the topic of topology also produced beautiful diagrams (source).
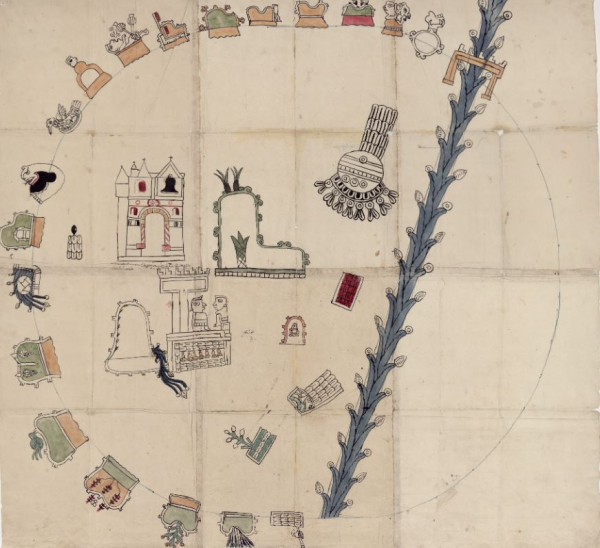
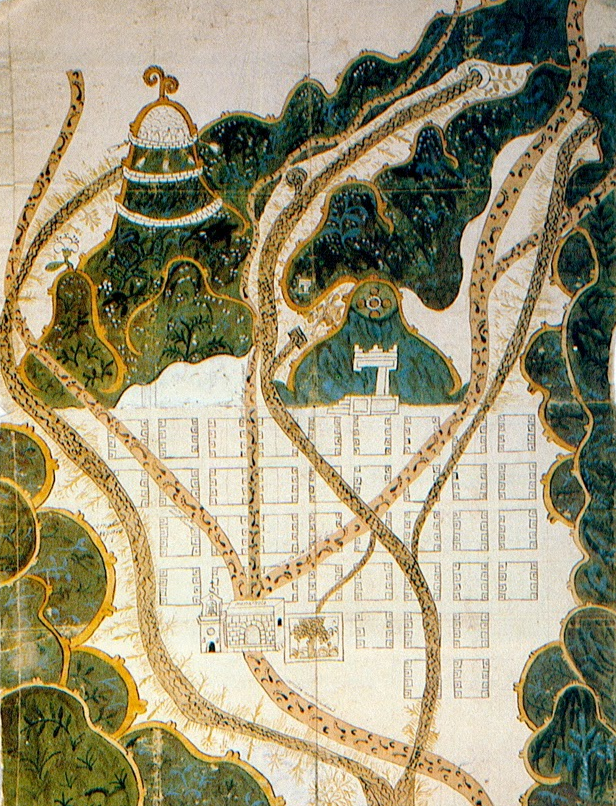
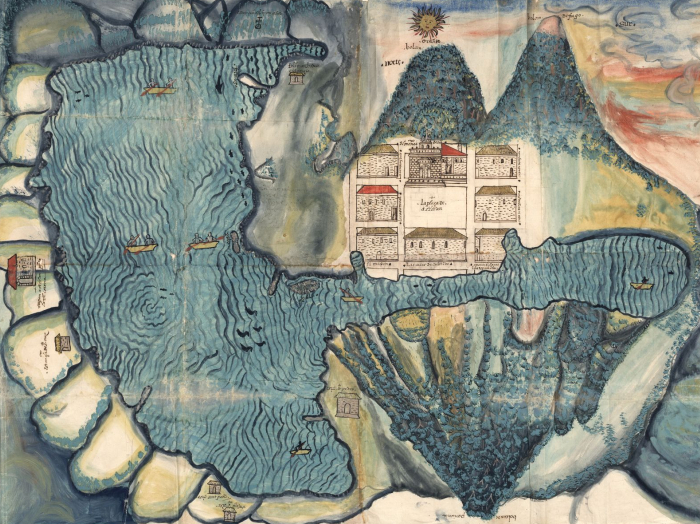
Relevant to the previous deleuzo-guattarian “geologies” is the relaciones geográficas. In response to questionnaires distributed across central America during Spanish colonization, local indigenous artists were commissioned to draw maps. I’m especially satisfied when topological maps are drawn inaccurately to perspective.
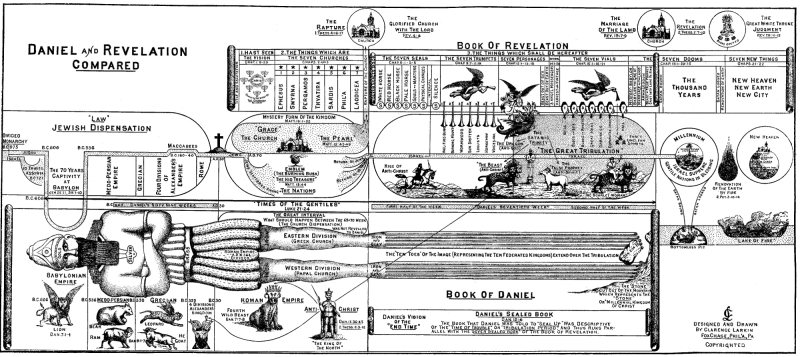
The artist Clarence Larkin drew very elaborate timelines of the Bible.
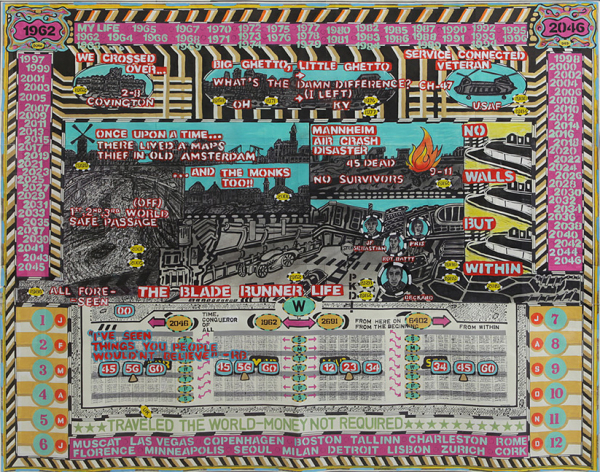
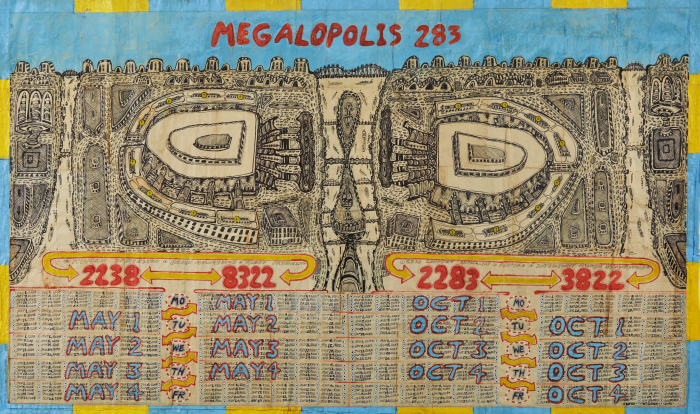
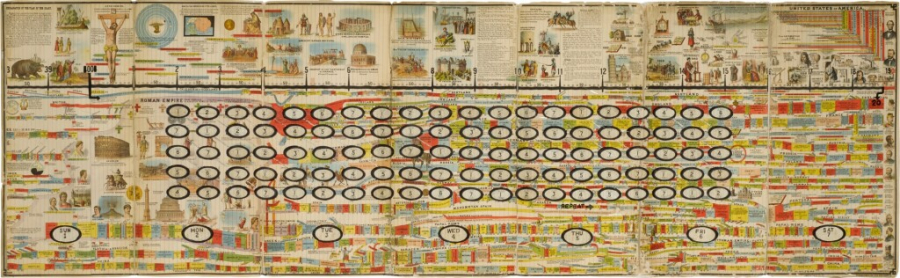
George Widener had a more secular vision for timelines and calendars. It seems like he was inspired by the tradition of Clarence Larkin because one of his works, “Stream of Time” (the third below), is drawn over a timeline by Sebastian C. Adams, who first showed up when I forgot Larkin’s name and googled 'american christian artist that drew big graphs of biblical timelines.'
Lastly is a blog by someone who visualized all the books ever identified by ISBN: https://phiresky.github.io/blog/2025/visualizing-all-books-in-isbn-space/. I don’t know what the words mean but I like to scroll through the images.